
- What: Anthropic released a beta feature enabling Claude to generate interactive charts, diagrams, and mini-apps.
- Technology: Real-time generation of JavaScript (Chart.js), HTML, and CSS visualizations.
- Availability: Now available in beta and enabled by default for Claude users.
- Pricing: Integrated into standard Claude token usage; costs vary by visualization complexity.
Anthropic has officially rolled out a new beta feature for its Claude AI model that allows the chatbot to generate interactive charts, diagrams, and dynamic visualizations directly within conversations. Moving beyond static text and basic image generation, the update enables Claude to build on-demand mini-apps that users can manipulate with sliders, buttons, and animations to better understand complex data.
According to an official blog post and reports from The Register, this capability is now on by default for users. The feature represents a significant shift in how LLMs handle data representation, moving away from simple "depiction" and toward functional, interactive software generation.
Beyond Static Images: The Tech Behind the Charts
Unlike typical AI image generation, which often relies on pixel-based diffusion models, Claude’s new visualization engine works by generating code on the fly. The model utilizes the visualization library Chart.js along with HTML and CSS to render functional components in-line.
Anthropic previously previewed this capability under the internal label "Imagine with Claude" last fall. By maturing the feature into a beta service, the company is positioning Claude as a tool for "just-in-time" utility. These visualizations are designed to be temporary, conversational aids, distinguishing them from the more persistent "Claude Artifacts" feature that allows for long-form content and code management.
In practical terms, when a user asks Claude to explain a concept like compound interest, the AI does not just provide a paragraph of text. Instead, it emits an interactive chart equipped with sliders. Users can adjust variables such as interest rates or timeframes and watch the visualization update in real-time, effectively bypassing the need to search for specialized calculators or ad-heavy financial websites.
Conversational Evolution and Customization
One of the most powerful aspects of the update is the ability for visualizations to evolve through natural language. During testing by The Register, Claude was asked to demonstrate compound interest and subsequently asked to add an "inflation slider" to the chart. The AI updated the underlying JavaScript code immediately, adding the new functionality without requiring the user to write a single line of code.
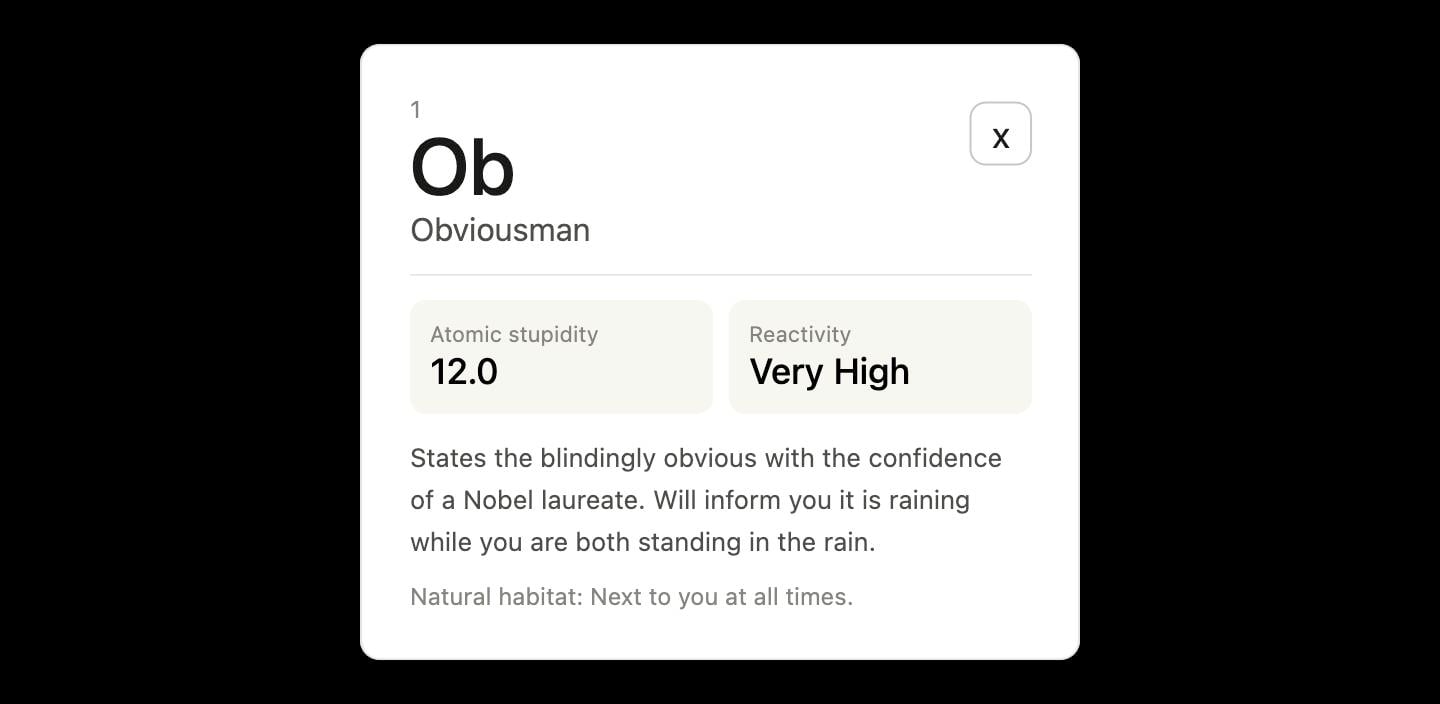
The model’s flexibility also extends to more creative and unconventional requests. The Register reported asking Claude to create an "interactive table of elements but instead of elements, depict idiots." The model complied, generating a grid of 36 satirical "elements" with popup windows. One example included "Obviousman," an entry that described someone who "informs you it is raining while you are both standing in the rain."
This level of compliance and creativity suggests that Anthropic has tuned the model to handle diverse visualization requests while maintaining the safety guardrails for which the company is known.
Impact on Data Analysis and the Competitive Landscape
For developers and data analysts, this update changes the workflow for rapid prototyping. Instead of manually coding a mock-up for a dashboard or a data trend, a user can describe the data to Claude and receive a functional, interactive JavaScript component in seconds.
The move marks a clear escalation in the "visual AI" arms race. While OpenAI recently launched features in ChatGPT to generate interactive visualizations for math and science concepts, and Google Gemini has introduced interactive educational images, Anthropic’s approach leans heavily into the generation of versatile mini-apps.
"This changes how users consume information; for the first time, the AI isn't just telling you the answer, it's building the dashboard for you to explore it," noted industry analysts regarding the shift toward interactive LLM outputs.
What’s Next for Claude’s Visualizations
As the feature is currently in beta, Anthropic is expected to refine the stability of the generated code and potentially expand the libraries Claude can utilize beyond Chart.js. While the service is currently enabled by default, the company has not yet detailed how these interactive tokens will be billed in the long term for API users versus web interface users.
As AI models move closer to becoming "agents" capable of creating their own tools, the ability to spin up temporary interactive interfaces represents a bridge between chat-based assistance and full-scale software development.